Ecommerce Profit Margins: Where Photography Sits in Your Cost Structure
Your product photography is not just a creative expense, it is a line item that quietly cannibalizes your ecommerce profit margins every time you launch a new collection. Most founders treat photography as a fixed overhead that just happens, but the reality is that bloated production costs turn high-performing products into margin-thin liabilities. You are likely paying for human logistics rather than actual pixel quality when you rely on traditional studio cycles.
Definition
Ecommerce profit margin represents the percentage of your revenue that remains after covering the cost of goods sold, marketing, and operational overhead. It is the core metric that dictates whether your store remains sustainable or slowly loses cash on every order processed.
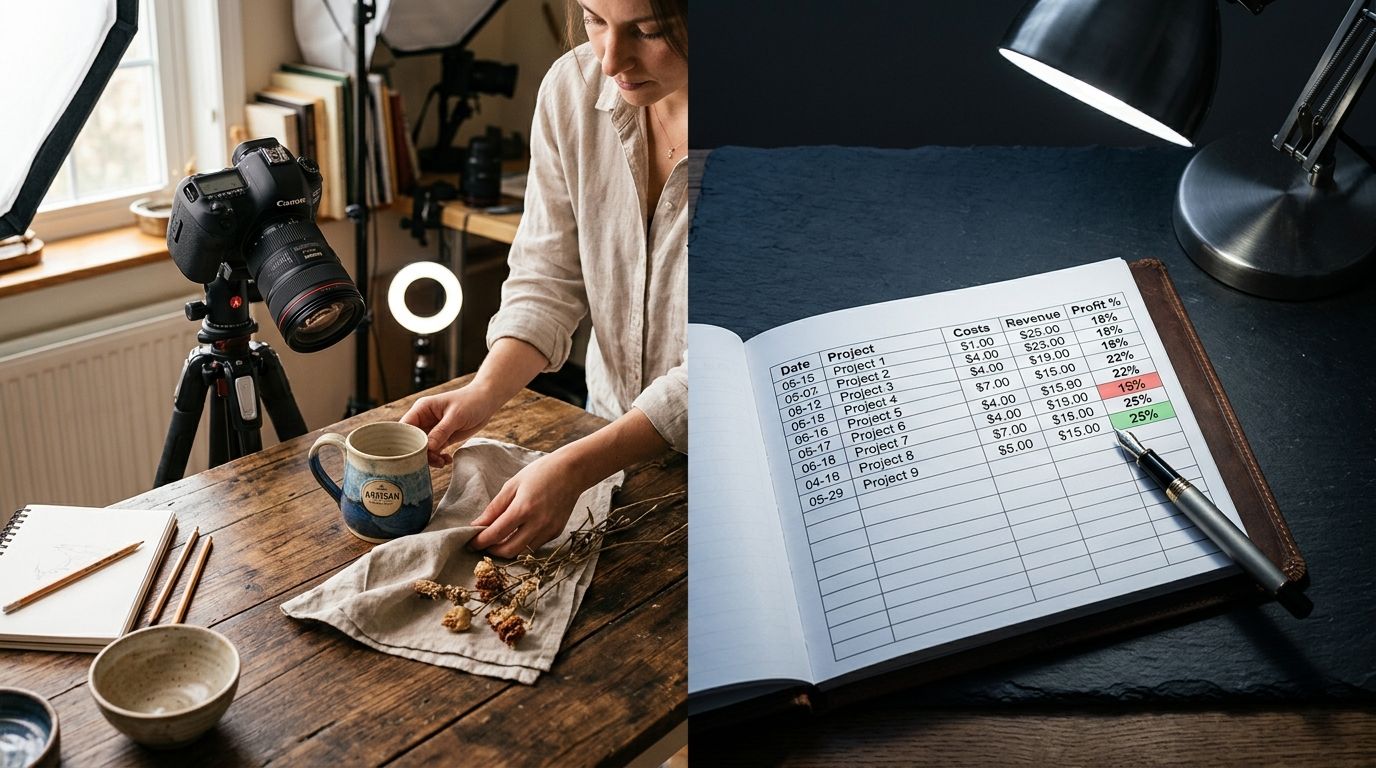
The True Cost of Content Production
I have spent years managing brand budgets where we would drop five figures on a single day of shooting, only to realize half the shots were unusable due to minor angle issues or lighting shifts. When you look at your the real cost per SKU, you have to account for the stylist, the photographer, the studio rental, and the inevitable three weeks of waiting. This creates a bottleneck that slows down your entire go-to-market strategy.
When you fix these inefficiencies, you stop bleeding margin on assets that do not move the needle. A more agile approach involves looking at AI photography cost vs. studio shoot to see where the math actually balances in your favor. It is common to see brands spend 15% of their initial revenue on launch imagery, which is far too high for a scalable store.
Where Margin Leaks Happen
Every day that your products are not live on the site due to production delays is a day of lost opportunity. If you are waiting on a photographer to edit images, you are losing. (Yes, the opportunity cost is real, even if it does not appear on your monthly P&L statement.) You need to be able to spin up new creative assets in hours, not weeks, to keep your profit margins healthy.
| Production Method | Turnaround Time | Relative Cost |
|---|---|---|
| Traditional Studio | 3-6 Weeks | High (Per Project) |
| Freelance Photographer | 1-2 Weeks | Medium |
| CherryShot AI | Minutes | Low (Per Image) |
Improving Your Bottom Line
Increasing margins is rarely about slashing the quality of your site, but rather about being smarter with your asset creation. Reducing your dependency on external teams allows you to pivot your creative direction as soon as you see a trend emerging. High-quality imagery has a direct correlation with your impact on return rates because customers know exactly what they are getting before they click buy.
Efficiency vs. Quality Trade-offs
Sometimes you need the high-touch, human-led creative shoot for your main seasonal hero campaign. That is fine, and it is a necessary investment. However, for 90% of your product catalog and social media testing, you do not need a three-day shoot. You need speed, consistency, and a way to generate assets without blowing your quarterly budget.
Frequently Asked Questions
What is a typical ecommerce profit margin by category?
Net profit margins for successful ecommerce brands usually range between 10% and 20% after accounting for all operational expenses. Apparel and accessories often struggle with lower margins due to high return rates and customer acquisition costs. Conversely, specialized goods or niche consumer electronics can see higher returns if they maintain strict control over their overhead and production expenses.
How much should an ecommerce brand spend on product photography?
Most lean teams should aim to keep photography production costs at or below 5% of the total cost of goods sold. Spending significantly more often indicates inefficient production workflows or reliance on expensive, external studio bookings for routine catalog updates. Review your recurring costs to ensure you are not overpaying for standardized assets that do not directly drive a proportional lift in conversion.
What is the ROI calculation for investing in better product photography?
Calculate ROI by measuring the delta in your conversion rate against the total production cost of the new imagery set. If a $500 investment in a fresh, professional image set lifts your conversion rate by even 0.5% over a month of high traffic, the project pays for itself through increased volume. Focus on how clear, high-quality visual representation reduces friction for the buyer at the point of decision.
How does photography cost affect gross margin per SKU?
Photography expenses act as a fixed cost that erodes your gross margin if it is not spread across enough sales volume. If you photograph a single SKU and only sell ten units, the cost per unit becomes prohibitively high for your bottom line. You must amortize these creative expenses across your total expected sales or find cheaper ways to produce the necessary volume of high-quality visuals.
Key Takeaways
- Photography spend is a variable expense that impacts your net margin more than most founders realize.
- Traditional studio shoots create logistics bottlenecks that kill your speed to market.
- Amortizing photography costs across total SKUs is the only way to accurately track margin impact.
- AI-powered tools provide high-quality, on-demand assets that dramatically reduce per-SKU production costs.
Audit your product photography budget today
If you are spending more than 5% of your COGS on routine product imagery, you have room for optimization. See how fast your team can generate professional catalog images by moving the process to an automated workflow.
Try CherryShot AIKeeping your margins healthy is not about doing less, but about choosing where to spend your budget with intention. When you use tools like CherryShot AI, you regain control over your production timeline.