Ecommerce Return Rate Statistics 2026: The Numbers Every Brand Needs to Know and the Visual Variable They Leave Out
Every ecommerce operator eventually hits the ceiling of top-line growth and is forced to look at their margin. When that happens, the first thing they find is a massive leak labeled "returns." Understanding ecommerce return rate statistics in 2026 is not an academic exercise for analysts. It is a survival requirement for any brand scaling past seven figures. Reverse logistics will eat your net profit whole if you ignore the root causes.
Definition
The ecommerce return rate is the percentage of total online orders that customers send back to the retailer for a refund or exchange. It serves as a critical metric for evaluating product satisfaction, expectation management, and overall operational efficiency. High return rates directly erode net profit margins through the compounded costs of reverse logistics.
Most founders and operations teams treat returns as a shipping problem. They spend months negotiating fractional rate decreases with carriers or researching 3PL software to shave seconds off the warehouse inspection process. They are optimizing the symptom. The disease is that the customer bought a product based on a digital promise and received a physical reality that failed to match it.
You cannot fix your margin until you accept that returns are largely a visual expectation problem.
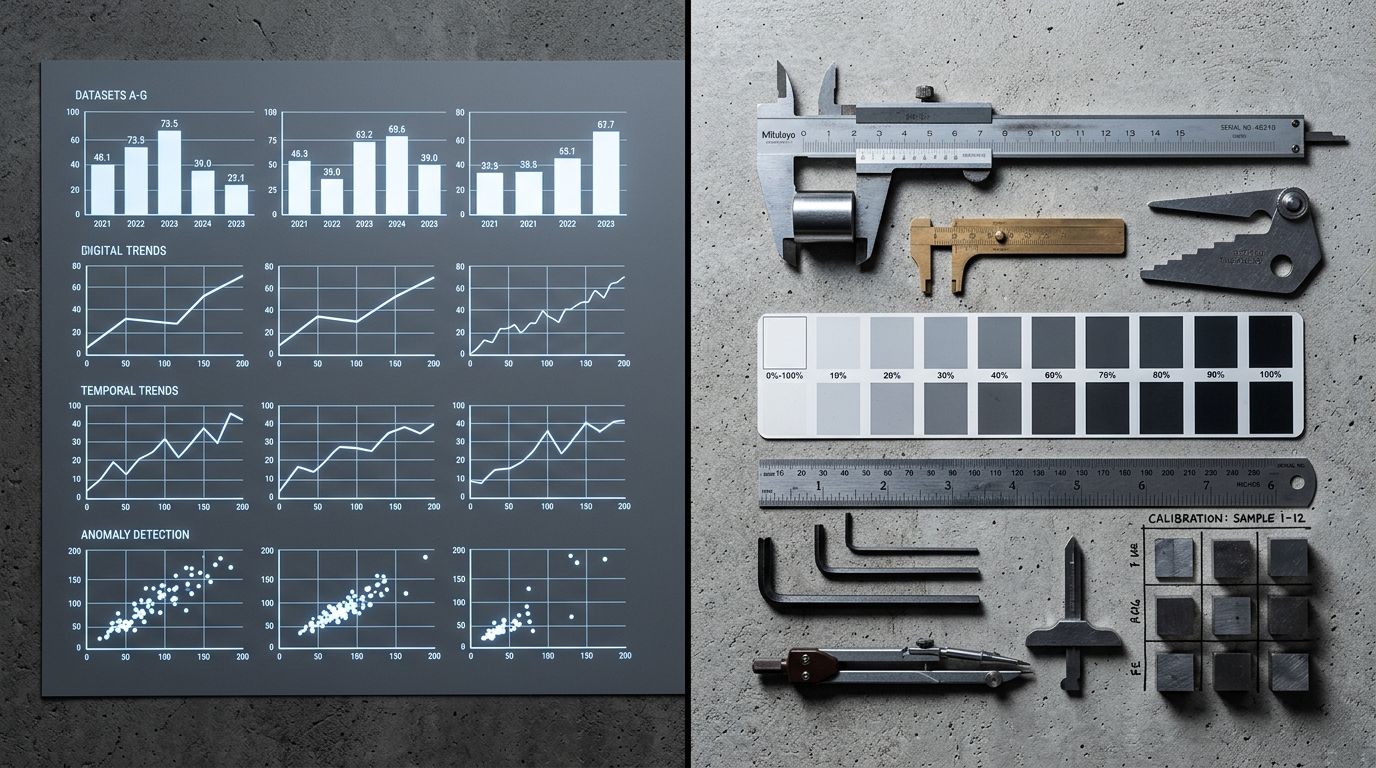
Visualizing the gap between digital expectations and physical reality.
The Brutal Reality of Online Shopping Return Statistics in 2026
Retail return rate statistics paint a very clear picture. People send things back more often than they ever have before. The friction of the return process has been engineered down to zero. A customer can drop an unboxed, unpackaged sweater at a local grocery store kiosk, scan a QR code, and get their refund instantly.
This convenience is fantastic for the consumer. It is a nightmare for the merchant.
When you dig into ecommerce return data, you find that the baseline 17.6 percent average masks the real pain felt by specific sectors. A brand selling dog food or vitamins rarely deals with returns. A brand selling cocktail dresses or luxury sneakers deals with them constantly.
Return Statistics by Industry Breakdown
Apparel remains the undisputed king of reverse logistics. Online clothing brands routinely see return rates between 25 and 30 percent. During the weeks following Black Friday, some fast-fashion brands push past 40 percent. The customer behavior is entrenched. They buy two sizes of the same jacket knowing they will send one back.
Electronics hover around 15 percent. These returns are usually driven by a misunderstanding of compatibility or technical specs. Home goods and furniture sit lower, near 8 percent. The physical effort required to repackage a dining chair acts as a powerful deterrent. But across all these categories, one common thread unites the highest percentage of avoidable returns.
The Missing Variable: The "Item Did Not Match" Epidemic
Look at your own Shopify or backend return data. Filter out the returns marked "defective" or "arrived damaged." Those are supply chain and carrier issues. Now look at the massive chunk of returns labeled "item did not match description" or "changed mind."
(Worth noting: some returns are genuinely unavoidable due to sizing inconsistencies across manufacturing runs. If your factory changed a pattern block without telling you, no photo will save that sale. But a dress looking emerald green online and arriving teal in person is completely on you.)
When a customer says the item did not match the description, they are rarely talking about the bullet points in your copy. They are talking about the photos. The product photography return correlation is the strongest lever a brand can pull. When you understand how product photos affect your ecommerce return rate, you realize that your imagery is not just marketing collateral. It is expectation management.
Traditional studio shoots are notorious for creating this gap. You pay a photographer three thousand dollars for a day rate. They set up three massive strobe lights. They bounce the light, they diffuse it, and they hit your product with an illumination that exists nowhere in nature. The texture washes out. The color shifts entirely. The photographer fixes it in post-production, eyeballing a slider until it looks "close enough" on a calibrated monitor.
Two months later, the customer opens the box in their kitchen and feels lied to. The product goes straight back into the mail.
The True Financial Math of a Returned Item
Most brands vastly underestimate the cost of a return. They look at the six dollars they paid for the return shipping label and accept it as the cost of doing business. But the hidden cost of bad product photography runs much deeper than the carrier invoice.
Consider the lifecycle of a returned sweater. The customer initiates the return. You pay the return label fee. The item arrives at your 3PL. The warehouse charges you a receiving fee. An employee has to open the package, inspect the garment for stains or wear, re-fold it, put it in a new polybag, and scan it back into active inventory. You pay a labor fee for that entire process.
By the time that sweater is ready to be sold again, you have spent fifteen dollars handling it. If you only made twenty dollars of margin on the initial sale, you just did all that work for five dollars. If the item is seasonal and returns to the warehouse too late, you have to mark it down to clear it out. Now you are losing money on the unit.
Why Scale and Context Matter
Color accuracy is only half the battle. Scale and context are just as vital. A white background studio shot tells the customer exactly what the product looks like floating in an infinite void. It tells them nothing about how big it is, how it catches the light in a real room, or how it sits next to a human body.
When you sell a handbag and only show it on a white background, the customer has to guess its size. If they guess wrong, it gets returned. Giving them visual context anchors their expectations.
Using AI to Close the Expectation Gap
If the solution to reducing returns is providing more accurate, context-rich imagery, the historical barrier has been cost. You cannot rent a mid-century modern living room to shoot one new coffee mug. You cannot book an editorial model every time a new t-shirt colorway arrives from the factory.
AI product photography solves the logistics and the cost simultaneously. Instead of scheduling a shoot three weeks out, you upload a basic reference image. You select a mode like Lifestyle, Influencer, or Minimalist, and CherryShot AI drops that product into a hyper-realistic environment. The scale is correct. The lighting interacts with the texture naturally.
| Photography Approach | Visual Context | Impact on Returns |
|---|---|---|
| Standard Studio Shoot | Isolated product on a plain white background with zero scale reference. | Drives up 'item did not match' returns due to guesswork. |
| Context-Rich AI Generation | Hyper-realistic lifestyle environments that anchor the product in physical reality. | Reduces expectation gaps and lowers visual-driven return rates. |
More importantly, it allows you to show the product from multiple angles and contexts without ballooning your budget. The data is clear on this. Brands consistently find that fixing high return rates with a new approach to photography requires volume. A single hero image is not enough anymore. Customers need to see the product in use, zoomed in on the fabric, and placed next to familiar objects.
When you reduce the cost per image from eighty dollars to under five dollars, you can afford to fill your product carousel with eight distinct images instead of three. You remove the guesswork. You eliminate the "changed mind" return reason before the customer ever clicks the checkout button.
Key Takeaways
- The average ecommerce return rate sits near 17.6 percent, bleeding margin through shipping and restocking fees.
- Apparel and footwear suffer the most, with rates routinely pushing past 25 percent.
- "Item did not match description" is heavily driven by poor color grading and lack of scale in studio photos.
- Replacing limited studio shots with abundant, context-rich AI imagery directly lowers expectation-based returns.
Frequently Asked Questions
What is the average ecommerce return rate in 2026?
The average ecommerce return rate in 2026 sits at 17.6 percent across all retail categories. This blended baseline figure obscures the severe financial strain experienced by specific sectors like apparel and footwear, which routinely suffer rates between 25 and 30 percent. Retail operations crossing the 20 percent threshold without an aggressive strategy to monetize reverse logistics face immediate and devastating margin erosion.
What percentage of online purchases are returned?
Approximately one in every five online purchases is ultimately sent back by the consumer. The prevalence of free return shipping has conditioned shoppers to treat their living room as a primary fitting room, often ordering three sizes to guarantee a single fit. This entrenched consumer behavior forces brands to process a massive volume of avoidable returns during peak holiday buying seasons.
What industries have the highest return rates?
Apparel and footwear consistently dominate reverse logistics channels with return rates frequently exceeding 25 percent. Consumer electronics generate the second highest volume at roughly 15 percent, driven largely by compatibility misunderstandings and technical buyer remorse. Home goods sit much lower between 7 and 10 percent, as the sheer physical friction of repacking a coffee table acts as a natural deterrent.
What does return rate data say about product photography?
Return data reveals a strict financial correlation between inaccurate product photography and high refund volumes. Consumers selecting "item did not match description" on reverse logistics forms are almost universally pointing to misleading visual assets rather than incorrect text descriptions. Fixing inaccurate color grading, providing complete angle coverage, and injecting clear scale reference into product galleries immediately drives this highly preventable return category down.
How have ecommerce return rates changed over time?
Ecommerce return trends demonstrate a steady, compounding increase over the entire course of the last decade. Brands initially offered frictionless return policies as an aggressive customer acquisition tactic, inadvertently normalizing the costly behavior of over-ordering across the broader retail sector. Modern operators have now shifted away from simply facilitating easy returns toward actively preventing them through highly accurate product visualization and better sizing data.
Every return your brand processes is a failure of information. The customer thought they were buying one thing, and you shipped them another. Closing that information gap requires giving them context they can trust. Stop relying on sterile studio shots that look nothing like reality, and start using tools that put your products into the spaces where your customers actually live.
Audit your product visual context to stop margin leaks
Review the photography on your highest-return SKUs and identify where customers lack scale or true color representation. Replace sterile white-background shots with varied, context-rich environments that anchor reality. If traditional lifestyle shoots break your budget, use CherryShot AI to generate those environments directly from your existing catalog.
Try CherryShot AI