Customer Return Requests and Product Page Failures: How to Diagnose Which Images Are Causing Your Returns
If your return data shows a spike in "item not as described" requests, your customer did not make a mistake. Your product page lied to them.
Definition
Customer return request diagnosis is the systematic analysis of post-purchase buyer feedback to identify discrepancies between online presentation and physical reality. Ecommerce operators use this specific data to pinpoint inaccurate catalog imagery and fix deceptive product pages that drain net margin.
Founders spend thousands of dollars optimizing their ad funnels and checkout flows to acquire a customer. When that customer finally converts, receives the item, and immediately requests a return label, the first reaction is usually to blame the buyer. We assume they did not read the description or they did not check the size chart. We write it off as an inevitable cost of doing business online.
That assumption is a massive leak in your net margin. When you look closely at customer return requests, you will find that a significant portion of reverse logistics costs are entirely preventable. They are not caused by defective manufacturing or shipping delays. They are caused by a direct visual failure on your product page. The images you used to sell the item created an expectation that the physical product could never fulfill.
Sorting the Data Trash from the Truth
Every ecommerce operator has access to return data. Whether you use a dedicated platform like Loop Returns or process RMAs directly through Shopify, you have a ledger of reason codes. The problem is that most brands treat this data as a financial metric rather than a diagnostic tool.
A proper return request analysis requires skepticism. Customers are often lazy when clicking through a return portal. They will select the very first option in the dropdown menu just to get their refund processed faster. Because of this noise, you cannot take every individual reason code at face value. Instead, you must look for return request patterns at the SKU level.
Identifying the Photography Return Correlation
To find the real issues, export your return data for the last ninety days. Strip out anything related to shipping damage or fulfillment errors. Sort the remaining data by specific product variants. You are looking for SKUs that have an outsized return volume compared to their sales volume.
When a specific shirt has a thirty percent return rate while your store average is twelve percent, you have a target. Dive into the individual customer comments for that specific shirt. If you want to understand exactly how much margin you are losing to these visual discrepancies, reviewing how product photos and return rate correlate will show you exactly where the cash is bleeding out of your business.
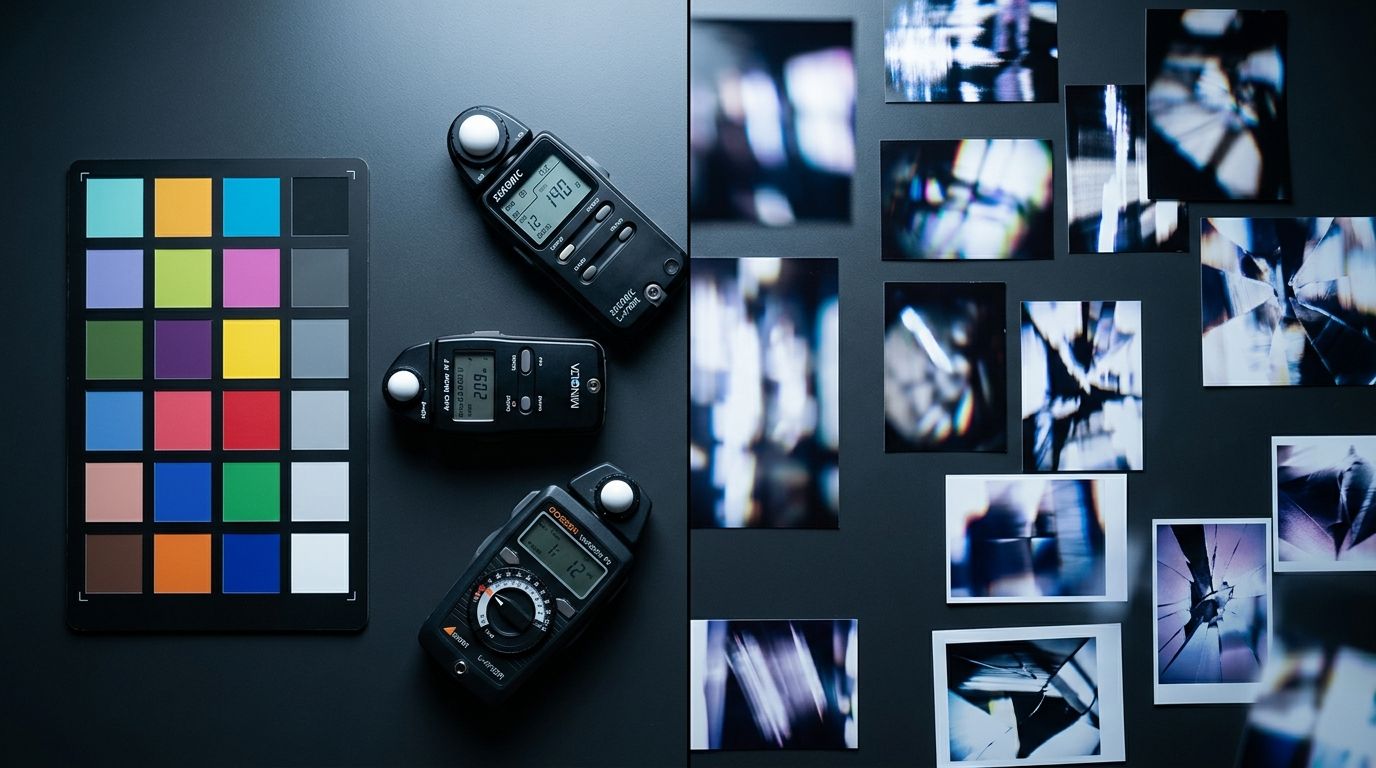
Reviewing your visual assets alongside return codes reveals exactly where the product presentation failed to match reality.
Spotting the Specific Product Page Failures
Once you identify a high-return SKU, you must audit the product page causing returns. Open the page on your phone. Look at the image carousel the exact same way a rushed buyer would. Do not read the description. Customers do not read descriptions. They look at the first three photos and make a purchasing decision.
(Worth noting: this is usually the step where founders get defensive. You spent a fortune on that studio shoot, and the lighting is objectively beautiful. But beautiful lighting does not lower return rates if it hides the fact that the jacket lacks side pockets.)
When you conduct this product page audit, you are looking for three specific types of visual deception.
| Customer Return Code | Root Visual Failure | Corrective Action |
|---|---|---|
| Color not as expected | Over-saturated thumbnail image | Replace with color-accurate lifestyle shot |
| Smaller than expected | Product isolated in white void | Add context image with everyday object |
| Style not as expected | Fabric stuffed or pinned in studio | Show material in natural draping state |
The Color Mismatch Pattern
This is the most common reason why customers request returns. The color of the physical item does not match the image on the screen. This happens for a very specific reason during the production phase. Traditional studio photographers use incredibly powerful strobe lighting to eliminate shadows and make the product look crisp. This intense light often blows out the true color of the fabric.
Later in the process, a retoucher will artificially boost the saturation to make the thumbnail image pop on a category page. The result is a vibrant pink shirt on the website that arrives at the customer's door as a muted, dusty rose. The customer feels tricked, files a return request, and loses trust in your brand.
The Scale Misunderstanding
A pure white background is the industry standard for ecommerce, but it is also a massive trap for scale. When a product floats in a white void, the brain has no contextual clues to determine its actual size. A tiny ten-inch skillet looks absolutely identical to a massive fourteen-inch family pan when both are cropped to fill a square frame.
If your return reason analysis shows customers complaining that an item is smaller than expected, your product page has a scale failure. You are missing a lifestyle image that places the product next to a universally recognized object. A coffee mug, a hand, or a standard laptop provides instant subconscious sizing information that a line of text in the description can never achieve.
The Texture Surprise
Texture failures occur when stiff, rigid materials are photographed to look soft, or vice versa. I have seen countless returns for leather tote bags that looked highly structured in the catalog images. Customers bought them expecting a bag that would stand up on a desk. In reality, the bag was made of soft, slouchy leather. The only reason it looked structured online was because the stylist stuffed it full of tissue paper during the studio shoot.
The product page failed the customer by presenting a false physical property. The return code simply says "style not as expected," but the root cause is a misleading photography tactic.
Fixing the Product Page Faster Than Your Next Restock
Diagnosing the return data diagnosis is only half the battle. The operational nightmare begins when you realize you need to replace the offending images immediately. Leaving a deceptive product page live means accepting continued margin loss on every new sale. But booking a traditional studio reshoot takes three weeks and costs thousands of dollars.
Any brand still running a full studio shoot to fix a single missing context image in 2026 is paying for logistics, not quality. The invoice is studio rental, the stylist's half-day minimum, and weeks of waiting. The math simply does not work for fixing an active leak in your conversion funnel.
Eliminating the Studio Bottleneck
AI product photography changes that math completely. When you identify a missing scale shot through your return request analysis ecommerce audit, you do not have to wait for a studio. You can upload a basic reference shot of the product to CherryShot AI, select the Lifestyle mode, and generate the missing context image in minutes.
The per-image cost drops to under $5. The turnaround goes from three weeks to an afternoon. You can generate a lifestyle image showing that skillet on a real kitchen stove, providing instant scale to the customer. You upload it to Shopify that same day and the return leak is plugged.
Admittedly, AI product photography is not going to replace a highly stylized editorial shoot featuring a celebrity model. That level of bespoke human direction still demands a studio. But for generating the specific, functional catalog images needed to clarify scale and texture, it is the only workflow that matches the speed of modern ecommerce.
Once you identify the offending visual assets, deploying a framework for fixing high return rates ensures you replace the right images without disrupting your live traffic.
Testing the Fix and Monitoring the Data
After you swap out the deceptive images with accurate, context-rich photos, you must monitor the product page. You are looking for two things. First, the return rate for that specific SKU should normalize to your store average within a month. Second, you should monitor your conversion rate.
Sometimes, clarifying the reality of a product will slightly lower the initial conversion rate because you are actively filtering out buyers who wanted something else. This is a good thing. A slightly lower conversion rate paired with a drastically lower return rate results in a much higher retained margin. To be certain your new visuals are actually improving net revenue, you should consistently A/B test your product photos to measure retained profit, not just top-of-funnel clicks.
Stop accepting high return rates as the cost of doing business. Your customers are telling you exactly why they are sending items back. Read the data, look closely at your product pages, and swap the deceptive images for ones that tell the truth. Your margins will reflect the effort.
Key Takeaways
- Return reason codes like "not as described" almost always point to a visual failure on your product page.
- You must filter return data by specific SKUs to spot patterns, ignoring generic store-wide averages.
- Missing scale, false color saturation, and hidden textures are the primary drivers of photography-related returns.
- Replacing deceptive images quickly using AI generation stops margin bleed without the delay of a studio reshoot.
Frequently Asked Questions
How do I find out why customers are returning my products?
Export the raw return data from your management platform and filter it by specific SKUs to identify localized problem areas. Looking at aggregate store-wide metrics hides the distinct visual presentation failures attached to individual products. Read the optional text comments left by customers during the return request to pinpoint the exact discrepancy between the imagery and the physical item.
How do I connect return data to specific product pages?
Build a return reason analysis matrix by pulling your twenty highest-volume return SKUs and calculating their specific return rate percentages. Opening the live product page on your monitor allows you to compare actual customer complaints directly against the existing image carousel. If buyers frequently state an item is too small, check your gallery for a missing scale reference.
What product page problems cause the most returns?
The highest volume of visual-related returns stems from false color representation, missing scale context, and hidden material textures. Intense studio lighting often washes out true fabric dyes while photo editors artificially boost thumbnail saturation to increase initial click-through rates. These standard industry practices create a false expectation that the physical product cannot fulfill when the customer opens the package.
How do I use return data to improve product photography?
Treat your return request patterns as a direct shot list for producing your next batch of visual catalog assets. If customers constantly cite size misunderstandings, generate lifestyle images that place the specific product next to an everyday object for immediate context. The data explicitly tells you what visual information the buyer lacked at the exact moment of purchase.
What is a return reason analysis for ecommerce?
A return reason analysis is the systematic process of categorizing, tracking, and diagnosing why physical items come back to your ecommerce warehouse. The practice deliberately separates unavoidable product quality defects from preventable marketing failures tied to misleading photography. Catching a color discrepancy issue early prevents continued margin loss on an otherwise perfectly manufactured and highly desirable product.
Audit your product page images before your next campaign
Take five minutes to compare your most frequently returned SKUs against their live image carousels. If you spot missing scale context or false color saturation, you can generate accurate replacement assets without booking a studio. CherryShot AI lets you create these context-rich lifestyle photos immediately to stop the margin bleed.
Try CherryShot AI